Easy to Use Dashboard for Everyone


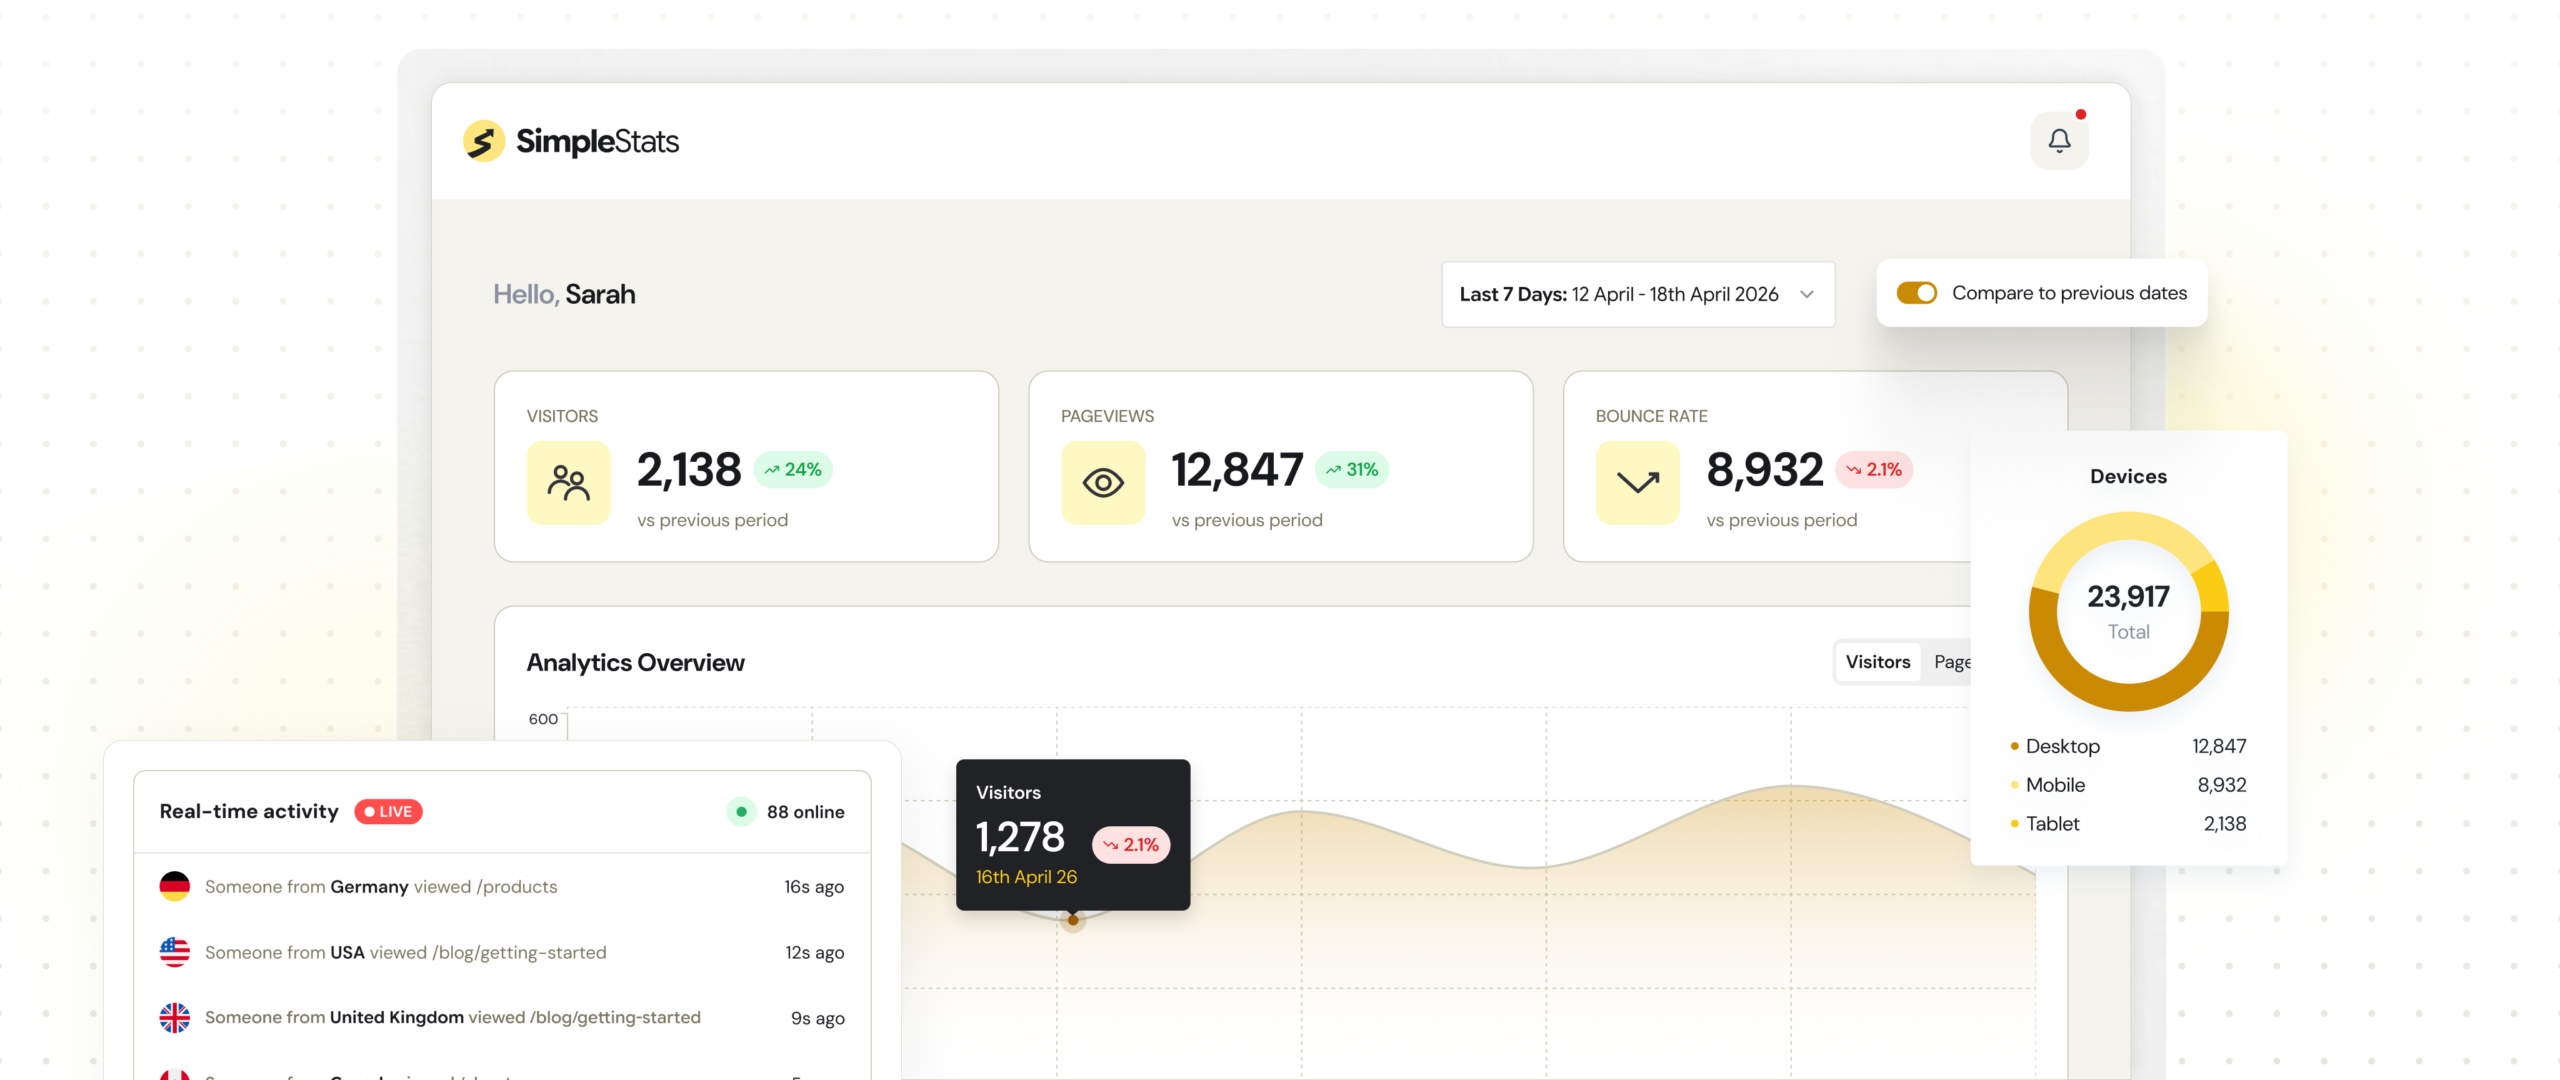
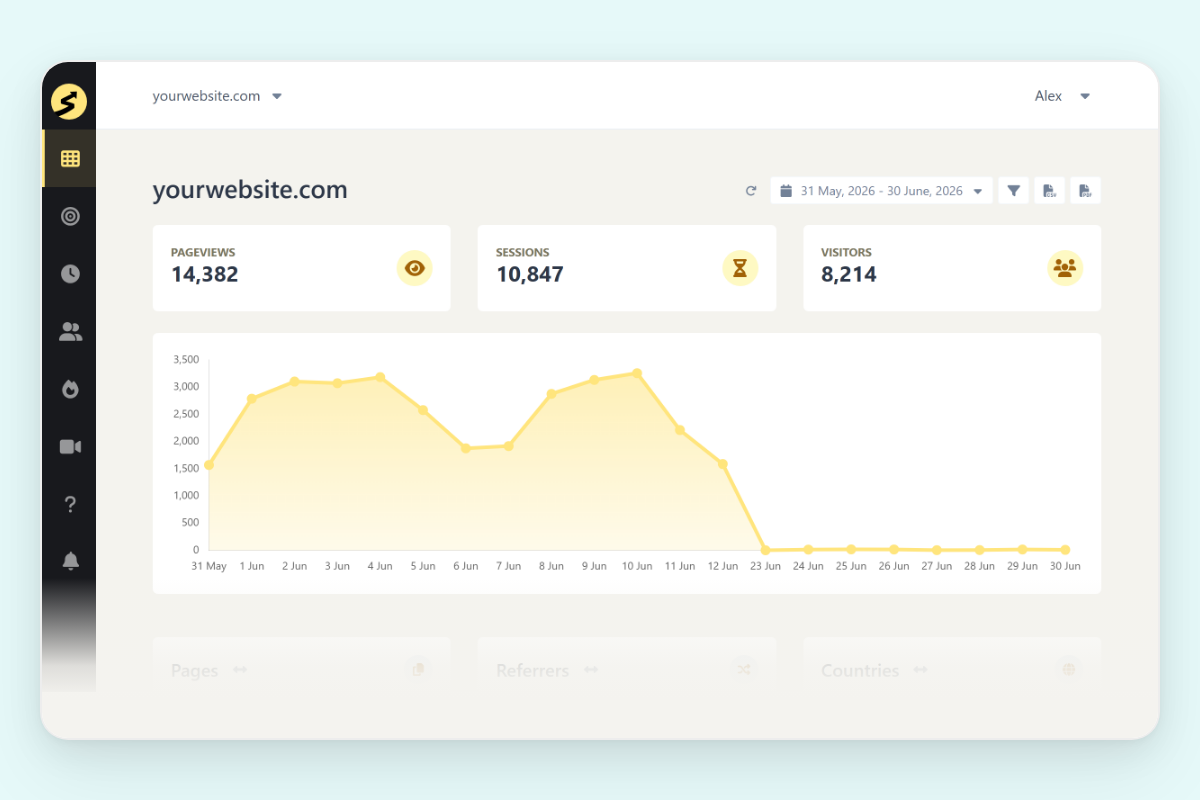
All your key metrics in one screen: pageviews, sessions, visitors, bounce rate, top pages, and referrers. Everything you need, nothing you don't.
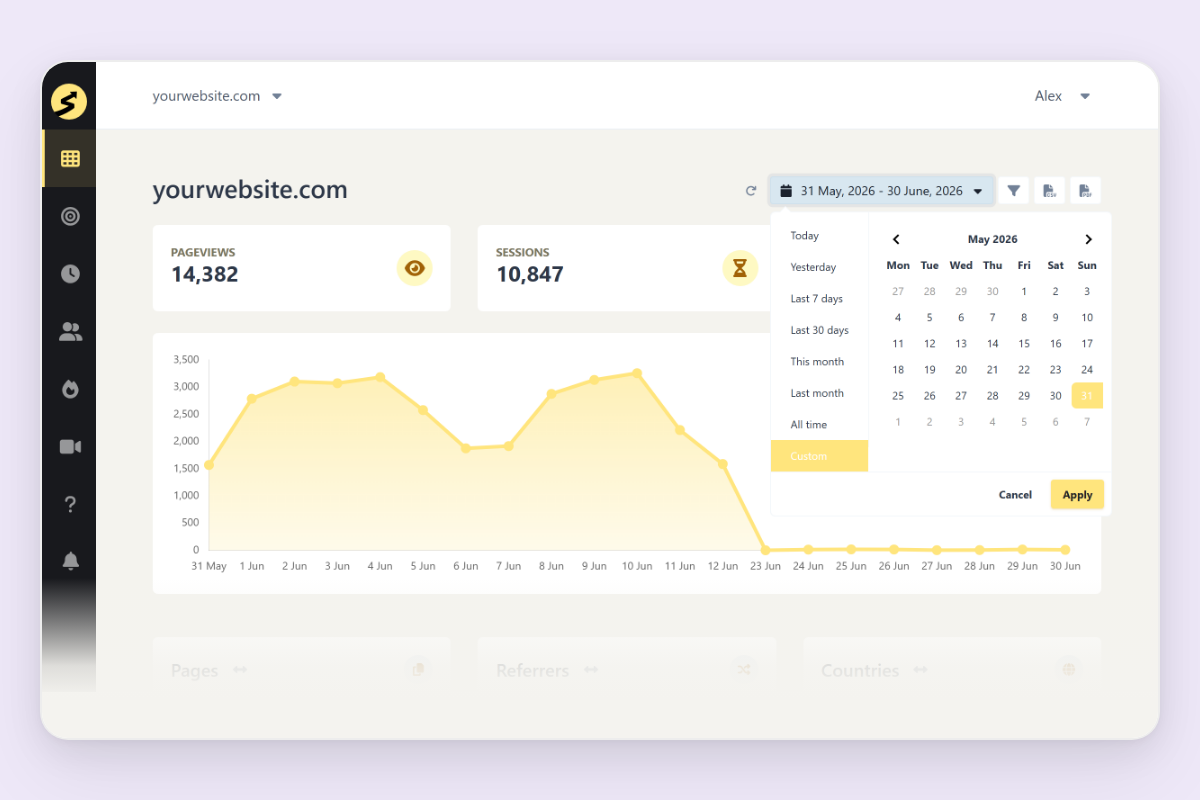
Download your analytics as a clean PDF or a raw CSV whenever you need it. Great for client reports, boss updates, or your own records.
Share a live view of your dashboard with team members or clients in a few clicks - no login required for them. Perfect for agencies and freelancers.
See who's on your site right now - active pages, devices, and locations updating live. No refreshing, no delays, no wondering.
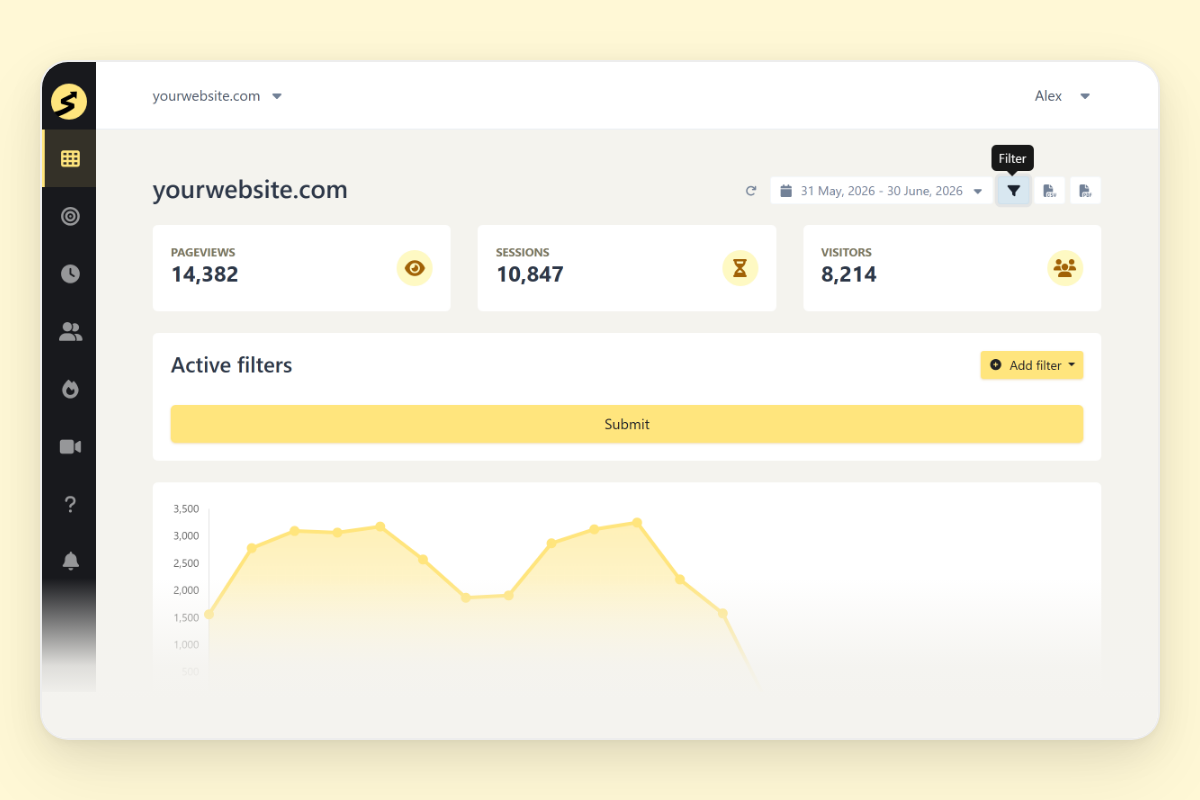
Slice your data by device, country, referrer, browser, or OS in one click. Zoom in on what matters most without exporting a spreadsheet.
Get a tidy weekly or monthly summary delivered straight to your inbox. No need to log in just to check how the month is going.
Your analytics history stays intact for up to 3 years. Track long-term trends, compare month-over-month, and always have the context you need.
SimpleStats stores your data on its own servers - not in your site's database. Your site stays fast no matter how much traffic you get.
WordPress, Shopify, Squarespace, or custom-built - SimpleStats connects to any site with one line of code. No platform lock-in, no developer needed.
See why hundreds of smart site owners are switching to SimpleStats to grow their websites.

Opening Google Analytics is a commitment. Dozens of reports, sidebar menus, and configuration options - and finding the three numbers you care about takes longer than it should. Most site owners end up checking nothing because the tool gets in the way.
SimpleStats puts everything on one screen. Log in and you see your pageviews, sessions, top pages, referrers, and audience breakdown - no menus. Your answer in seconds, not minutes.
You already know your overall traffic numbers. What you actually want to know is whether mobile visitors are bouncing more than desktop, or whether that recent blog post is driving referrals from a specific country. But pulling that data usually means exporting CSVs and building pivot tables.
With SimpleStats, you just click a filter. Narrow down by device, country, referrer, browser, OS, or screen resolution - and every number on the dashboard updates instantly. No exports, no extra tools, no analyst required.


If you manage a site for a client - or report numbers to a boss or colleague - you already know how this goes. Someone asks for an update, you log in, screenshot the dashboard, paste it, and repeat next month.
SimpleStats lets you share a live dashboard link in a few clicks. Your client or colleague sees the numbers in real time, no login needed. For agencies, it cuts out a recurring task that adds up fast.
Do you have a question about SimpleStats? See the list below for our most frequently asked questions. If your question is not listed here, then please contact us.