

You’re staring at your Google Analytics 4 dashboard, trying to find a heatmap. Maybe you remember seeing one years ago, or you just assumed a tool this big would obviously have one. Either way, you’re clicking through menus and coming up empty.
Here’s the short answer: no, GA4 doesn’t have heatmaps. It never really did, not in the way most people mean the word. Here’s what happened to the version you might be remembering, what GA4 tracks instead, and what an actual heatmap would show you.
In This Article:
What Google Analytics 4 Actually Tracks
GA4 automatically tracks a set of interactions it calls enhanced measurement: scroll depth, outbound clicks, site search, video engagement, file downloads, and form starts and submissions. That sounds close to a heatmap, but it isn’t one.
For scrolling, GA4 only logs whether someone reached 90% of the way down a page, as a single event. For clicks, it only tracks links that lead off your site, and it doesn’t record where on the page that link was. It has nothing to say about a page with no outbound links at all.
In other words, GA4 can tell you an interaction happened. It can’t show you a visual picture of where.

This is the entire list. Turn every toggle on, and you still won’t get a single screenshot of your page with color-coded clicks on it. That’s not a setting you missed. It’s a feature GA4 doesn’t have.
Whatever Happened to the Google Analytics Heatmap?
If you remember something heatmap-like in Google Analytics, you’re not imagining it. Google used to offer a Page Analytics Chrome extension that overlaid click data onto your live site. Google discontinued it years ago, and it only ever worked with old Universal Analytics tracking codes, so it has no idea what to do with a GA4 property.
Universal Analytics also had a built-in report showing your busiest days and hours as a color-coded grid. GA4 dropped that too. You can rebuild something similar with a GA4 Exploration exported into Looker Studio, but it’s a report you have to put together yourself, not something sitting in your dashboard the way it used to be.
Getting More Out of GA4 Before You Add Another Tool
If you’re not ready to add a separate heatmap tool yet, GA4’s Explorations can still get you partway there. Path Exploration shows a tree of the pages and events people move through, step by step, so you can see where a chunk of visitors peel off between your homepage and your checkout page.
That’s genuinely useful. It just answers a different question than a heatmap does. Path Exploration tells you which page people abandon on. It still won’t tell you where on that page they lost interest, or whether they even saw the button you wanted them to click. For that, you’re back to needing a visual tool.
What a Real Heatmap Shows That GA4 Doesn’t
A real heatmap is a visual overlay on your actual page, color-coded from cool to hot based on where visitors clicked, tapped, or how far they scrolled. Instead of a number in a report, you see the page itself, with the exact spots people paid attention to and the spots they ignored.
That’s a different kind of answer than GA4 gives you. GA4 can tell you your bounce rate is high. A heatmap can show you why: visitors are clicking on an image that isn’t even a link, while your actual call-to-action button sits untouched a few inches away.
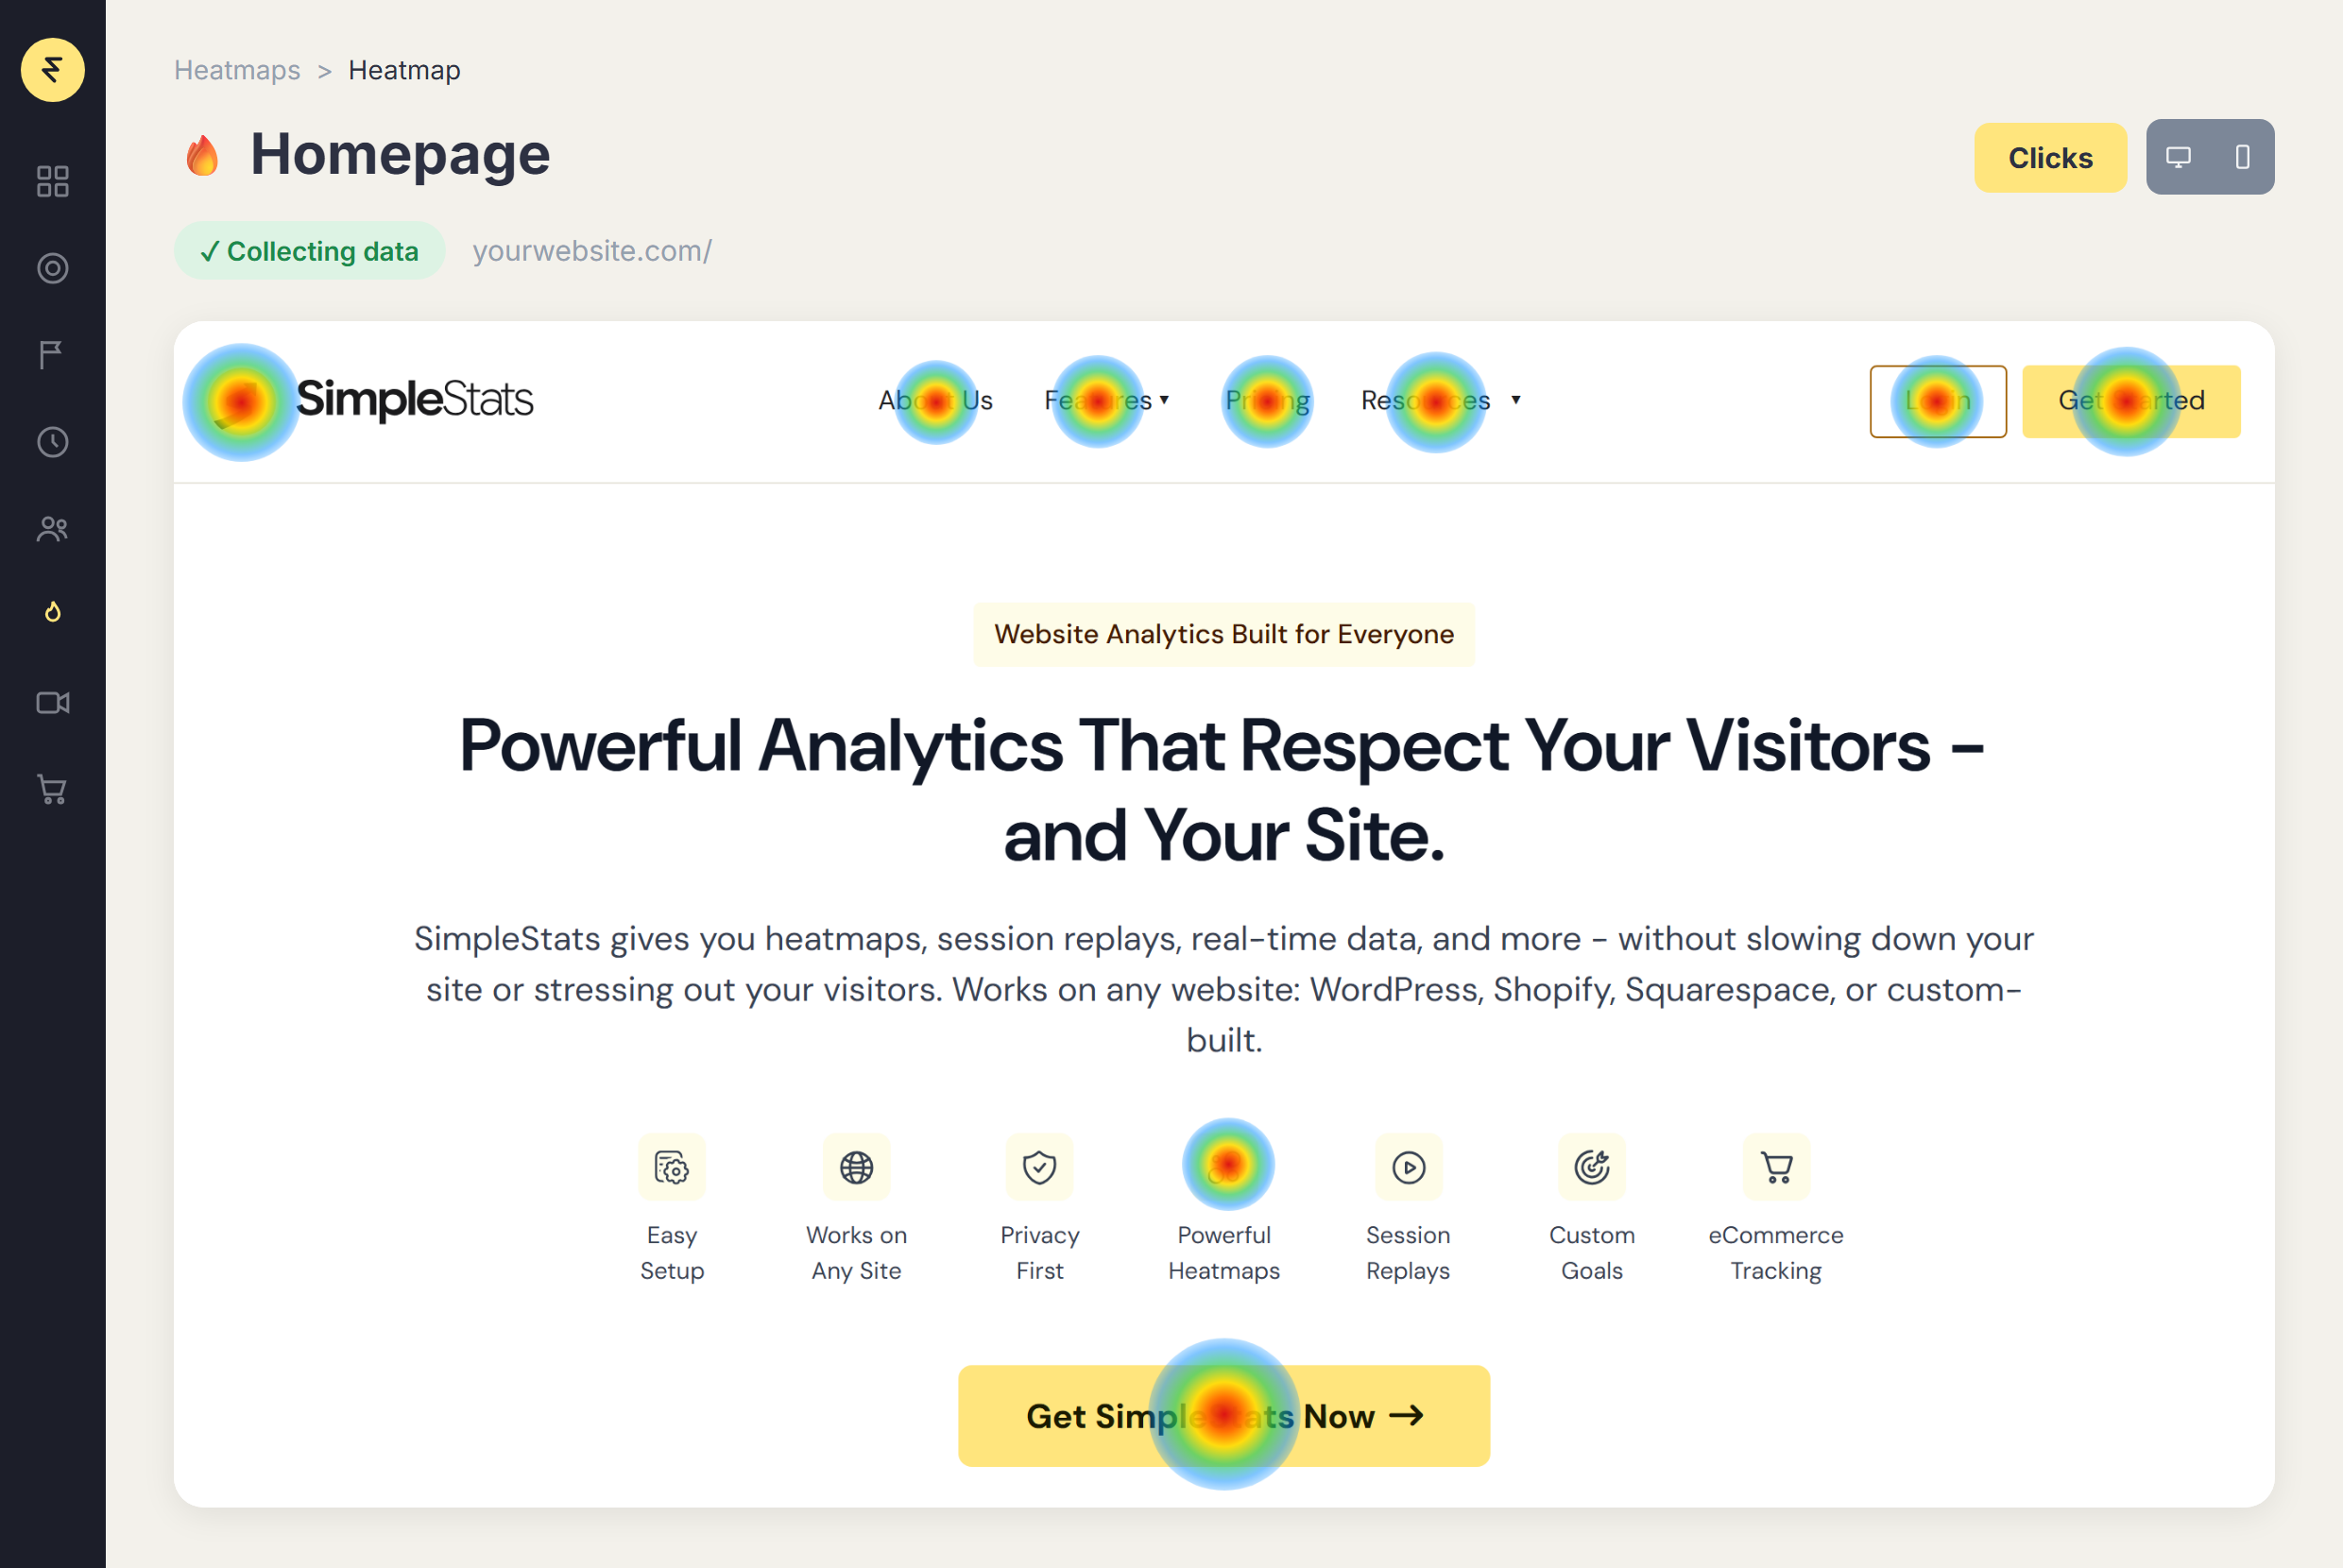
Key Takeaway: GA4 tells you that something happened. A heatmap shows you where. They answer different questions, and most sites need both.
Related Reading
Getting Real Heatmaps for Your Site
Since GA4 doesn’t do this, you’ll need a separate tool built specifically for it. SimpleStats is one option: a privacy-first analytics platform made to be simple to set up and easy to actually read, not another dashboard full of reports you have to learn. Your data stays on SimpleStats’ own servers, and it’s never sold, shared, or used for advertising.
What Each Dashboard Actually Looks Like
Side by side, the difference is easy to see. GA4’s reports are built around numbers and charts.
Google Analytics 4 Dashboard
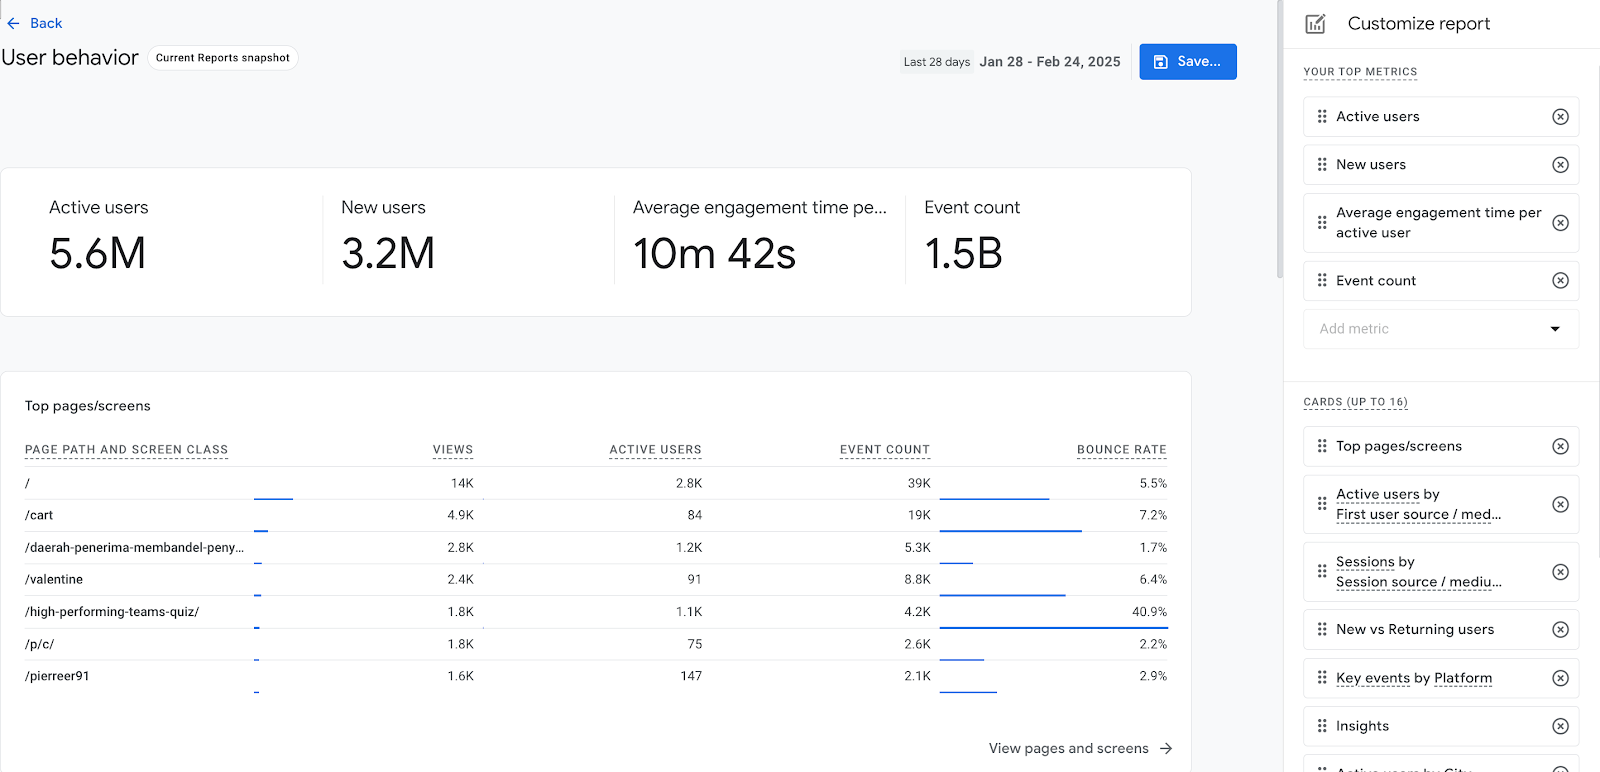
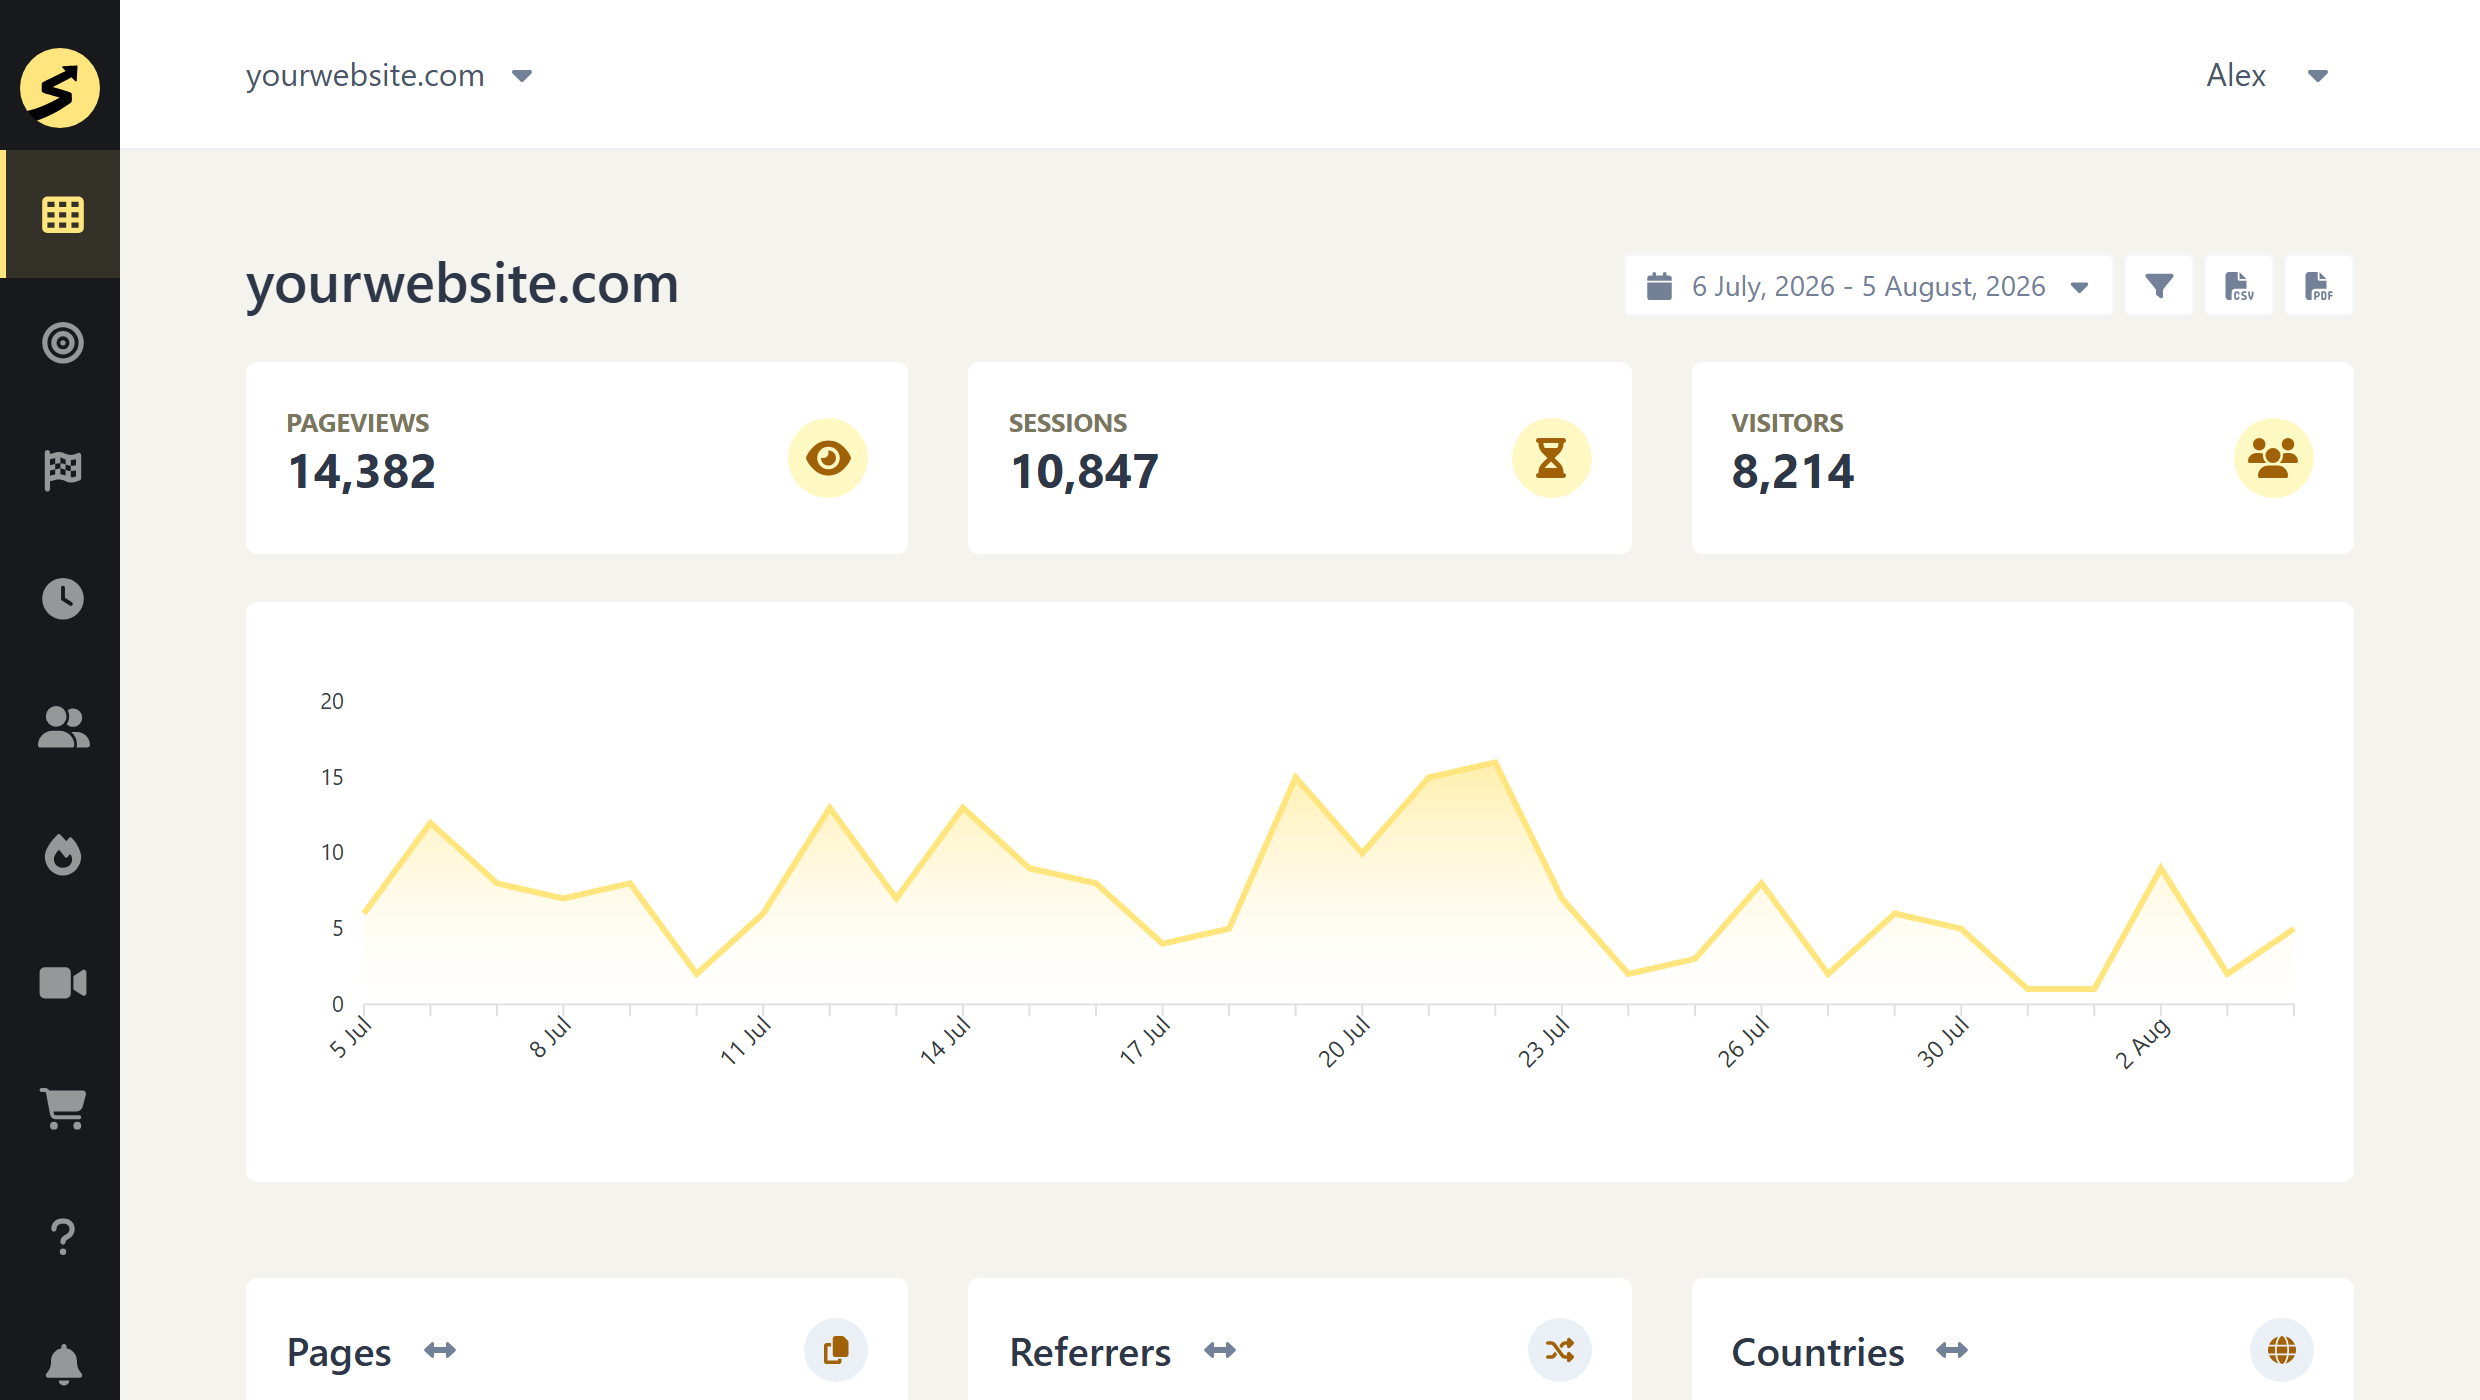
SimpleStats takes a simpler approach: traffic, visitors, and page performance in one clean view, instead of GA4’s separate reports for each metric.
SimpleStats Dashboard
Heatmaps are part of that. Real click-overlay heatmaps, like the one above, are included from the Pro plan ($19/month). Once you’re looking at real heatmaps, a few other things come along with it.
Session Replays: Watching One Visitor at a Time
Heatmaps show you an aggregate pattern across every visitor. Session replays, included on the same Pro plan, show you one specific visit: every click, scroll, and hesitation, in order, as it happened. If a heatmap tells you a form gets abandoned, a replay can show you the exact moment someone pauses on a confusing field and leaves.
Choosing Between Lightweight and Advanced Tracking
Heatmaps and session replays both run on SimpleStats’s Advanced tracking mode, which uses a small set of cookies and does require visitor consent. Advanced mode also keeps a history of returning visitors, so you can see someone’s past visits, not just their current one. If you’d rather stay fully cookie-free, Lightweight tracking skips cookies entirely, needs no consent banner, and hands you clean traffic numbers with zero setup. Heatmaps, replays, and visitor history live on Advanced instead.
Real-Time Data, Not a 24-Hour Wait
Data shows up in real time, not the 24 to 48 hours GA4’s standard reports can take to fully process. Refresh the dashboard, and the visitor who just landed on your site is already there.
Goals and Funnels Without Writing Code
A goal tracks a specific action you care about, like a signup or a completed purchase, so you’re not digging through raw pageview data to find it. In GA4, marking something you’re already tracking as a conversion is a quick toggle. But for anything GA4 isn’t already capturing, you first need to set up a new event through Google Tag Manager or code before you can mark it as one.
A Destination goal in SimpleStats skips that entirely: it fires the moment a visitor lands on a matching page, configured straight from the dashboard. Turn on a funnel and you’ll see exactly which step people drop off at, closer to what Path Exploration does in GA4, but without building a separate report to see it.
eCommerce and Multi-Site Reporting Built In
Running a store? In GA4, ecommerce reporting doesn’t just switch on. Purchase and revenue events need to be set up yourself, usually through Google Tag Manager or a store integration, before any of it shows up in your reports.
SimpleStats’ eCommerce Tracking, from the Hobby plan ($10/month), shows gross sales, order count, and average order value directly in the same dashboard, no custom event setup needed. Managing more than one site? Every property lives in one unified dashboard instead of switching between GA4 properties one at a time.
See Where Your Visitors Actually Click
Start free to see your traffic, no credit card needed, then upgrade to Pro whenever you want heatmaps and session replays.
Get SimpleStats Now →Frequently Asked Questions
Does Google Analytics 4 have heatmaps?
No. GA4 tracks scroll depth and outbound clicks as event counts through enhanced measurement, but it doesn’t show a visual overlay of where on a page visitors clicked or scrolled. That’s a different tool, not a GA4 feature.
Did Google Analytics used to have a heatmap?
Kind of. Google offered a Page Analytics Chrome extension that overlaid click data on your site, but Google deprecated it in Q3 2017 and never updated it for GA4. It only works with old Universal Analytics tracking codes.
Can I see a day-and-hour traffic heatmap in GA4?
Not natively. Universal Analytics had this built in, but GA4 doesn’t include it. You can rebuild it by exporting GA4 data into Looker Studio, though it takes manual setup rather than showing up in your dashboard automatically.
Can GA4 Path Exploration replace a heatmap?
Not really. Path Exploration shows which pages people move through and where they drop off between them, which is useful, but it can’t show where on a specific page someone clicked or how far they scrolled. That level of detail still needs a dedicated heatmap tool.
What’s the difference between GA4 and a heatmap tool?
GA4 measures what happened: pageviews, events, conversions, and where traffic came from. A heatmap tool shows you how visitors behave on a specific page, visually, so you can see what they click, how far they scroll, and where they lose interest.
GA4 is good at telling you what’s happening on your site in aggregate, but it wasn’t built to show you the moment-by-moment behavior a heatmap reveals. If you want that picture, a tool built specifically for it, like SimpleStats, will get you there.